Quantcast
Channel: ASP.NET – Code Corner
Viewing all 79 articles
Browse latest View live

Infragistics WebDataGrid: Hidden columns become visible after AJAX postback

$
0
0

A recent update to .NetAdvantage for ASP.NET v12.2 introduced a weird bug – hidden columns of WebDataGrid and WHDG become visible after postback. Service release 12.2.20122.2031 fixed that issue – but only for full postback. Under some circumstances if grid performs an AJAX call (sorting, paging etc.) hidden columns become visible again. This does not happen in IE, but other browsers, such as Chrome and FireFox do exhibit the issue.

This is happening because hidden columns lose “display:none” property in their style. If this happens to you – you have to take matter in your own hands.

First create a simple CSS class to hide columns:

.hiddenElement {
	display:none;
}

Then you need to loop thru all the columns in your grid, adding following code for each column.

If you set the “hidden” property programmaticaly in server-side code:

'... looping thru columns, and for each column perform:
oColumn.Hidden = True
oColumn.CssClass = "hiddenElement"
oColumn.Header.CssClass = "hiddenElement"

If “hidden” property is set in ASP markup:

'... looping thru columns, and for each column perform:
if oColumn.Hidden
   oColumn.CssClass = "hiddenElement"
   oColumn.Header.CssClass = "hiddenElement"
End If

Essentially what this does is forces “display:none” for hidden columns so they remain hidden. This loop can be added to grid Init or PreRender event.


Infragistics WebDataMenu last item disappears

$
0
0

While using Infragistics WebDataMenu control from their NetAdvantage for ASP.NET Suite (version 2012.2, current as of this post) I noticed that last menu item in horizontal menu disappears. To me this only happened in Firefox.

Disappearing Act

This post suggested to set EnableScrolling menu property to False as a solution. Which is fine and well, but did not work for me since I need my menu to scroll (it has limited width available and menu items are added programmatically in code-behind so total items width can be wider than width available for the menu).

Solution turned out to be surprisingly simple. Just add an empty disabled item at the end of menu items collection, something like:

xMyMenu.Items.Add("").Enabled = False

and this new phantom item will push item, previously known as last into visibility:

Re-appearing Act

On this screenshot I marked new item as a dashed area, but in reality it will be invisible and unclickable.

FusionCharts.RenderChart and ASP.NET UpdatePanel

$
0
0

Fusion Charts

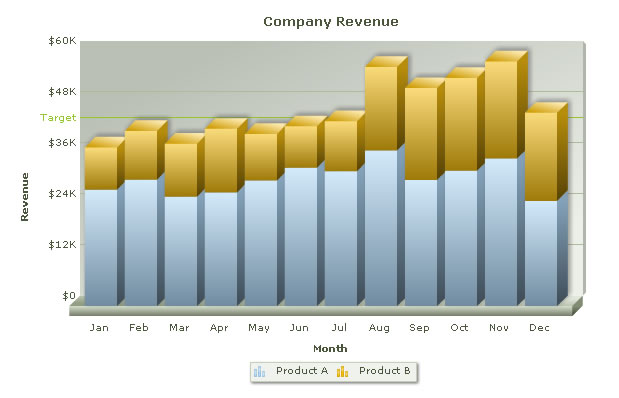
FusionCharts is a very cool cross-platform charting library – it offers huge variety of chart types and mind-blowing special effects. It also offers wide variety of chart rendering options both client- and server-side.

One such option is to render chart in an ASP.NET application. FusionCharts.dll that you get with the package offers handy FusionCharts.RenderChart method that generates all the client-side code you need to display a beautiful chart. Usually it is used something like this:

xLabel1.text = FusionCharts.RenderChart("FusionCharts/Pie2D.swf", "", sChartXmlData, sChartID, iChartWidth, iChartHeight, False, True)

where xLabel1 is a Label or Literal control in your ASPX page and FusionCharts.RenderChart is a function that accepts number of parameters, like chart type, chart XML data, dimensions etc.

It works very well until you want to render the chart inside of Microsoft Ajax UpdatePanel – then nothing works. This happens because FusionCharts.RenderChart function emits some HTML along with JavaScript that do not work during partial postback. FusionCharts suggest hooking up to UpdatePanel life-cycle events, but it’s seems like an overkill, and often doesn’t work (especially if you have a complex project, which this hookup can interfere with). But there’s an alternative solution.

Let’s take a look at what output of FusionCharts.RenderChart looks like:

<!-- Using ASP.NET VB FusionCharts v3.2.2.1 Wrapper and JavaScript rendering -->

<!-- START Script Block for Chart xfsChart -->  

<div id='xMyChartDiv' >  Chart.  </div>  

<script type="text/javascript">  

if (FusionCharts && FusionCharts('xfsChart') ) FusionCharts('xfsChart').dispose();  

//<snip>...script continues..<snip>
</script>

<!-- END Script Block for Chart xfsChart -->

This generated-for-client code consist of HTML with the DIV where chart will be rendered (DIV gets its ID by adding “Div” suffix to the chart ID you supplied) and some JavaScript to render the chart. What if we could run that JavaScript ourselves?

We can. Microsoft’s ScriptManager that controls the UpdatePanel has a handy RegisterStartupScript method that executes JavaScript during partial postbacks. So, if we extract just the JavaScript from the generated client-code, we can execute it on our own.

But first – don’t forget to add the DIV container to your HTML markup inside of UpdatePanel – because it will not be generated automatically.

<div id='xMyChartDiv'></div>

Next we need to extract just the JavaScript part e.g. part between <script> and </script> tags. Once that part is extracted we can run it via ScriptManager.RegisterStartupScript method:

Dim sRederedChart as String = FusionCharts.RenderChart("FusionCharts/Pie2D.swf", "", sChartXmlData, "xMyChart", iChartWidth, iChartHeight, False, True)
Dim sStartScriptTag As String = "<script type=""text/javascript"">"
Dim sEndScriptTag As String = "</script>"
Dim sJsCode as string = sRederedChart.Substring(sRederedChart.IndexOf(sStartScriptTag) + sStartScriptTag.Length, sRederedChart.IndexOf(sEndScriptTag) - sRederedChart.IndexOf(sStartScriptTag) - sStartScriptTag.Length) & ";"

ScriptManager.RegisterStartupScript(Me, Me.GetType, "JSCode", sJsCode, True)

Line 1 generates client-side code for the chart, but instead of outputting it directly to the page stores it in a String variable.
Lines 2-4 extract just JavaScript portion of the client-side code
Line 6 pushes this code to the client where it will be executed rendering chart inside of a DIV we specified above.

That’s it – no additional script references needed, no messy hookup – it just works. To make this approach a bit more universal instead of direct use of ScriptManager.RegisterStartupScript a wrapper function can be used that will correctly embed JavaScript code both during normal and partial postback.

Solution for Infragistics WebDataGrid filtering error “Length cannot be less than zero”

$
0
0

Infragistics WebDataGrid/WHDG controls for ASP.NET offer nice filtering features. Out of the box you just have to enable the behavior and badabingo:

WebDataGrid filtering

There is one glitch though in the way text filtering is implemented: If you enter an empty string as a filter value – an error is thrown:

Async refresh failed. Length cannot be less than zero

Apparently internal grid code cannot handle empty strings (as of version 12.2) so we have to take matter in our own hands.

Add following code to your grid’s DataFiltering event handler:

Protected Sub xMyGrid_DataFiltering(sender As Object, e As GridControls.FilteringEventArgs) Handles xMyGrid.DataFiltering

    For I As Integer = e.ColumnFilters.Count - 1 To 0 Step -1
        If e.ColumnFilters(I).ColumnType = "string" Then
            If DirectCast(e.ColumnFilters(I).Condition, GridControls.RuleTextNode).Value = "" Then
                e.ColumnFilters.RemoveAt(I)
            End If
        End If
    Next

    'rebind the grid to datasource as needed
End Sub

Essentially what is happening here – we loop thru all column filters, check if it’s a text column and if it is – check its filter ‘s value. If it’s an empty string – we simple removing the filter from the collection. Error is gone, filter is performed as expected.

Solution: eventArgs.get_type() incorrectly detects header of WebDataGrid in FireFox as cell

$
0
0

If you use CSOM of Infragistics WebDataGrid you may encounter a bug in client-side event handlers. Let’s say some action is needed on double clicking of a grid cell. The handler looks something like this:

function xMyGrid_DoubleClick(sender, eventArgs) {
   if (eventArgs.get_type() == "cell") {
      //perform action
   }
}

IF condition on line 2 makes sure that action is executed only if actual grid cell is double clicked. If you double click column header, eventArgs.get_type() would return "header" and the action would be skipped.

But not in FireFox. In that browser eventArgs.get_type() returns "cell" even when header is clicked. So an additional condition is needed. Grid column header is rendered as a TH HTML element and this is what we can check:

function xMyGrid_DoubleClick(sender, eventArgs) {
   if (eventArgs.get_type() == "cell" &&  eventArgs.get_item().get_element().tagName != 'TH') {
      //perform action
   }
}

This solution works universally in all browsers.

Norton 360 Provides Security, Identity Protection, PC Tune-up, and More

$
0
0

Are you looking to secure your computer from the infectious viruses lurking on the Internet? Are you interested in getting your PC running as fast as possible? Are you hoping to protect your identity and keep your personal information safe from intruders and scammers who will stop at anything to steal it? If so, Norton 360 has everything you are looking. Norton 360 is the all-in-one security protection software produced by Symantec that works around the clock to protect not only your computer, but you, from potential security breaches that can happen without you having the slightest idea.

Norton 360 has been updated to find and kill the most serious viruses, implementing a five layer protection system that discovers and terminates threats faster than competing software. The threat removal layer digs deep into the confines of your system to get rid of treacherous threats and viruses, while the network defense layer works to stop threats before they can even reach your system. Meanwhile, SONAR technology and constant threat monitoring keep your system in-check and monitored at all times, so that threats that have reached your computer can be detected and put to rest before the effects become noticeable and threats that exist online are weeded out from web searches and search engines, disallowing you from finding them and reaping the consequences that can occur.

While all of this is going on quietly in the background of your computer, Norton 360 is keeping your personal information guarded and your files organized, fixing any other problems that may be occurring and compressing data to keep your system running lightning fast. The security suite can be installed on up to three computers and/or devices, with cloud management controlling all devices from a single, central unit. Norton 360 users also have the option of backing up and restoring files (documents, music, videos, photos, etc.), installing parental controls, scanning and updating at all times of the day, and so much more. Norton 360 has so much to offer to all its customers. If you haven’t yet purchased a subscription, what are you waiting for?

FusionCharts: Use non-numeric Xaxis in Bubble and Scatter Charts

$
0
0

FusionCharts states in their documentation that in Bubble and Scatter Charts both X-Axis and Y-Axis must be numeric. But what if you want X-Axis to display some names or dates or other non-numeric values? That is still possible via label attribute of chart’s categories element.

The method below utilizes ADO.NET/VB.NET to build XML for chart data, but similar approach can be easily used in other languages/technologies.

Consider the following ADO.NET DataTable, called dtChartData:

               Login Failure  Login Success
-------------- -------------- -------------
2013-03-27     1              69
2013-03-26     0              32
2013-03-25     1              86
2013-03-22     0              11

It holds data for number of successful/unsucessful logins for a given date. We want to display this data as a Bubble chart with dates displayed on X-Axis.

Take a look at the following code snippet:

Dim sbXmlChartSeriesData As New StringBuilder

sbXmlChartSeriesData.Append("<categories>")

'Looping thru the first column, creating categories and X-Axis labels and values
For J As Integer = 0 To dtChartData.Rows.Count - 1
   sbXmlChartSeriesData.AppendFormat("<category label='{0}' x='{1}' showVerticalLine='1' />", dtChartData.Rows(J)(0)), J + 1)
Next

sbXmlChartSeriesData.Append("</categories>")

'Datasets - from the rest of the columns row by row
For I As Integer = 1 To dtChartData.Columns.Count - 1
   sbXmlChartSeriesData.AppendFormat("<dataset seriesName='{0}' >", dtChartData.Columns(I).ColumnName)

   For J As Integer = 0 To dtChartData.Rows.Count - 1
      sbXmlChartSeriesData.AppendFormat("<set y='{0}' x='{1}' ", dtChartData.Rows(J)(I), J + 1)
      sbXmlChartSeriesData.AppendFormat("z='{0}' ", i_dtChartData.Rows(J)(I))
      sbXmlChartSeriesData.Append("/>")
   Next

   sbXmlChartSeriesData.Append("</dataset>")
Next

Here we’re using a StringBuilder object to effectively build string with XML data

Lines 3-10 Build categories section of XML data. Note Line 7 -we use 1st column data (that contains dates) as a category label – that value will be displayed on the X-Axis. For a mandatory numeric X value we use row index, but that value will never be displayed since it will be overwritten by labels.

Lines 12-23 build dataset sections of the XML file. DataTable’s Column name is used for Series name (Line 14). Line 17 sets Y value to actual column value for current row and X value again to row index to match the X in the Categories section. Note Line 18: For Bubble chart this example reuses Y value for Z value (so the higher up Y-Axis the bubble, the bigger its radius will be), but you’re free to modify it to suit your requirements.

This code produces nice XML data that you can plug into your chart’s main XML:

<categories>
   <category label='2013-03-27' x='1' showVerticalLine='1' />
   <category label='2013-03-26' x='2' showVerticalLine='1' />
   <category label='2013-03-25' x='3' showVerticalLine='1' />
   <category label='2013-03-22' x='4' showVerticalLine='1' />
</categories>

<dataset seriesName='Login Failure' >
   <set y='1' x='1' z='1' />
   <set y='0' x='2' z='0' />
   <set y='1' x='3' z='1' />
   <set y='0' x='4' z='0' />
</dataset>

<dataset seriesName='Login Success' >
   <set y='69' x='1' z='69' />
   <set y='32' x='2' z='32' />
   <set y='86' x='3' z='86' />
   <set y='11' x='4' z='11' />
</dataset>

After adding attributes to main chart element to limit X-Axis values to xAxisMinValue='0' and xAxisMaxValue='" & dtChartData.Rows.Count + 1 & "'" – a beautiful chart is produced:

Bubble Chart with non-numeric X-Axis

With X-Axis displaying non-numeric data – in this case dates.

Infragistics WebTab: Simulating SelectedIndexChanging event when programmaticaly changing tabs via set_selectedIndex

$
0
0

Infragistics WebTab control is very versatile and offers rich server- and client-side model. Among client-side events are

  • SelectedIndexChanged – fires after user has changed the tab to provide ways to interact with newly selected tab
  • SelectedIndexChanging – fires before user has changed the tab to provide ways to interact with currently selected tab and to give user a chance to cancel change.

Both work fine if user manually changes tabs by clicking on tab headers, but call to client-side set_selectedIndex() function (which changes tabs programmaticaly) only fires SelectedIndexChanged, skipping SelectedIndexChanging altogether. But there’s a way to make it work.

Here’s a basic stub for SelectedIndexChanging event handler:

function xMyTab_SelectedIndexChanging(sender, eventArgs) {

   if (/* some condition is not met */)  {
      alert('You cannot switch tabs at this time');
      eventArgs.set_cancel(true);
      return false;
   }
   
   /* Perform some processing on the current tab before switching */ 
   
}

Lines Lines 3-7 can perform some validation (required text not entered, process is still going on) and if validation is not passed – cancel the tab selection (Line 5: eventArgs.set_cancel(true);). If validation is passed – we can continue processing current tab before switch to the new one.

Again, this works fine when user manually changes tabs by clicking on them. But let’s say you have a custom function:

function myTabChange(i_iTabIndex) {
   var oTab = $find('xMyTab');
   oTab.set_selectedIndex(i_iTabIndex)
}

It accepts Tab Index and selects it by calling set_selectedIndex function of the Tab control. It works fine, but unfortunately SelectedIndexChanging event is not firing, so there’s no way to perform those validations or pre-processing. But there’s a way to implement it (and avoid copy-pasting lots of code). Let’s modify our event handler stub just a little:

function xMyTab_SelectedIndexChanging(sender, eventArgs) {

   if (/* some condition is not met */)  {
      alert('You cannot switch tabs at this time');
      if (eventArgs) eventArgs.set_cancel(true);
      return false;
   }
   
   /* Perform some processing on the current tab before switching */ 
   
   return true

}

We added a line to call eventArgs.set_cancel only if eventArgs argument is passed to the event handler function; and the last line that returns true after successful validation and processing the code. With this change we can modify our custom function like this:

function myTabChange(i_iTabIndex) {
   var oTab = $find('xMyTab');
   if (xMyTab_SelectedIndexChanging(oTab) == false) return;
   oTab.set_selectedIndex(i_iTabIndex)
}

Line 3 that we added calls the same event handler function, but without passing eventArgs parameter. Our modified handler detects this and if its validation fails returns false. This will effectively cancel tab change in our custom function. After successful validation true will be returned and the tab change will proceed.

If the event handler is called normally – via user click – eventArgs parameter will be passed and handler will perform as before.


FusionCharts: Invalid Data when using javascript renderer (solved)

$
0
0

If you’re using FusionCharts you may encounter a strange issue – chart renders correctly when Flash renderer is in use and displays “Invalid Data” error message when falling back (or forced) to JavaScript renderer.

In most cases culprit is invalid XML data passed to the engine. And while Flash is more forgiving, JavaScript requires strict valid XML. Most often the cause for the issue are characters invalid in XML. Check your data and if they contain following characters – replace them with their encoded values:

" (quote) --> &quot;
' (apostrophe) --> &apos;
< (less sign) --> &lt;
> (greater sign) --> &gt;
& (ampersand)  --> &amp;

And the error will disappear.

Happy charting!

WebDataMenu: Use your own hover

$
0
0

Infragistics WebDataMenu comes with variety of styles and lets you specify your own. At a very basic it allows you to specify styles for normal menu items and hovered menu items:

<ig:WebDataMenu ID="xwdmMyMenu" runat="server">
   <ItemSettings CssClass="MenuItem" HoverCssClass="MenuItemHover"/>
</ig:WebDataMenu>

This markup can correspond to CSS classes, for example:

.MenuItem {
   background-image:none;
   background-color:white;
}

.MenuItemHover{
   background-color:rgb(213,224,198);
}

This works fine in most cases, but since the hover/unhover is done via JavaScript sometimes there’re issues.

One particular issue I encountered – if this is a context menu, on “showAt” call the first item is always hovered – which can be pretty annoying. There’re other issues as well, so instead of diggin’ dip into JavaScript, trying to overwrite some default behaviors I decided to keep it simple and let CSS do its thing.

If we modify the above HTML markup by removing hovered CSS class property completely:

<ig:WebDataMenu ID="xwdmMyMenu" runat="server">
   <ItemSettings CssClass="MenuItem" />
</ig:WebDataMenu>

And replace hover class in CSS definitions with pseudo-class:

.MenuItem {
   background-image:none;
   background-color:white;
}

.MenuItem:hover{
   background-color:rgb(213,224,198);
}

We will achieve the same hover effect without nasty side-effects.

Solution for WebHierarchicalDataGrid’s “Async request failed” error

$
0
0

This is a solution for specific (and maybe somewhat obscure, but it helped me, so perhaps it will be helpful to someone else) scenario for Infragistics’ WebHierarchicalDataGrid error “Async request failed“.

It could be accompanied by inner errors

Failed to load viewstate. The control tree into which viewstate is being loaded must match the control tree that was used to save viewstate during the previous request

or more generic

Object Reference not set

In this particular scenario WHDG uses manual LoadOnDemand for to populate children (i.e. RowIslandPopulating event is used) and parent grid is sorted by one or more columns. Error is happening when attempting to expand second child or a grandchild.

Chances are you’re manually populating SortedColumns collection of the parent grid:

For '..some loop condition
   xMyGrid.Behaviors.Sorting.SortedColumns.Add() '...adding to SortedColumns
Next

If so – the errors mentioned above happen because this code is called on page postback. To avoid them just check for the postback and if it is happening skip the code:

If Not IsPostBack Then 'Don't do this on PostBack
   For '..some loop condition
         xMyGrid.Behaviors.Sorting.SortedColumns.Add() '...adding to SortedColumns
   Next
End If

It is possible that you absolutely must execute this code on some postbacks. Then you only need to skip it when Child RowIsland is being populated and execute it on all other postacks. It is possible with AJAX callback detection. If you use function from that post then the code for skipping sorting will become:

If GetGridAjaxCallType() <> GRID_AJAX_CALL_TYPE.CHILD_POPULATING Then
   For '..some loop condition
         xMyGrid.Behaviors.Sorting.SortedColumns.Add() '...adding to SortedColumns
   Next      
End If

Using this approach grid’s SortedColumns collection will be updated in all the cases *but* when child is populating, effectively preventing errors from happening.

Solution for IE10 error: SCRIPT5022: Sys.ArgumentOutOfRangeException: Value must be an integer

$
0
0

If you’re testing your ASP.NET project in Internet Explorer 10, you may encounter following error:

SCRIPT5022: Sys.ArgumentOutOfRangeException: Value must be an integer.
Parameter name: (x or y)
Actual value was (some floating point value)
ScriptResource.axd, line … character …

Often it come up when you use some 3rd party libraries, Telerik or Infragistics (in my case it happened in WebDataMenu control).

Here why it happens. Actual error happens in Sys.UI.Point class. In its constructor it expects 2 parameters – x and y. If you trace the callstack you will see that these values are provided to the class by a preceding call to browser’s intrinsic function getBoundingClientRect(). In previous versions of IE it returned Integer values. But in IE10 values are floating point.

Now if you’re using older version of .NET Framework (e.g. 3.5 or below) you’ve got a problem. Sys.UI.Point class expects parameters to be strictly Integer. Since IE10 provides fractionals – error shown above is thrown.

There could be other incompatibilities, so the only real, non-hacky solution, well – upgrade your project to a more recent version of .NET framework (4.5 at the time of this post).

If upgrading is not possible and you’re willing to accept the risk of a hack – include following function into your page:

Sys.UI.Point = function Sys$UI$Point(x, y) {

    x = Math.round(x);
    y = Math.round(y);

    var e = Function._validateParams(arguments, [
        {name: "x", type: Number, integer: true},
        {name: "y", type: Number, integer: true}
    ]);
    if (e) throw e;
    this.x = x;
    this.y = y;
}

This function will replace original one and the only addition is rounding of incoming parameters.

Disable WebDataTree in client-side JavaScript

$
0
0

Let’s say you’re using Infrafitics WebDataTree’s server-side SelectionChanged event to perform some action when user selects a tree node. Now let’s say there’re times when you need to disable tree-selection (for example another control, e.g. WebDataGrid is being updated and clicking tree node during update will mess things up). Also you need to do it in client-side JavaScript (e.g. if that second control is inside of UpdatePanel – server-side updates will not affect controls outside the panel).

What to do? WebDataTree doesn’t have CSOM set_enabled() method and if you use client-side DOM’s:

$find('xMyTree').get_element().setAttribute('disabled','true');

tree may take appearance of being disabled in some browsers, but user can still select nodes.

Fortunately there is a solution (thanks Bhadresh from Infragisitcs techsupport for suggesting it). WebDataTree has SelectionType property (0 = None, 1 = Single, 2 = Multiple) that controls how many nodes can be selected in the tree. It also has a counterpart in client-side JavaScript set_selectionType(), so in order to disable selection simple use command

$find('xMyTree').set_selectionType(0);

Later on selection can be re-enabled either by passing 1 to above function or even server-side by calling

xMyTree.SelectionType = NavigationControls.NodeSelectionTypes.Single

WebHierarchicalDataGrid: get_scrollTop() returns incorrect value

$
0
0

Infragistics WebHierarchicalDataGrid has a neat client-side built-in function get_scrollTop() – it is used if at any point you need to retrieve current vertical scroll position of the grid (e.g. to use it in your own calculations to display something at a specific position on the grid – tooltip, help, additional info etc.)

Unfortunately the function has a bug: its value only set if user actually manually scrolls the grid: using mouse and scrollbar on the right, keyboard etc. If no scrolling user-interaction is involved and scroll position changes due to other means (e.g. displayed data size changes) – the function retains original value, throwing all your calculation out of whack.

Case in point: Consider for example paging in child bands:

Let’s say a child grid has 2 rows on page 1 and only 1 row on page 2. When you click on page 2 – grid scroll position changes due to change in displayed number of rows. But if you check the value, returned by $find("myGrid").get_scrollTop() – surprise – it returns the same value you had seen on page 1.

But there’s a workaround. Take a look at the scrollbar on the right. Detailed examination will show that it’s actually a separate DIV container. No matter what caused grid scroll position to change – this DIV’s DOM .scrollTop property will always be current. And you have access to this DIV via $find("myGrid")._elements.vScrBar property.

So if instead of

var iScrollPos = $find("myGrid").get_scrollTop()

You use

var iScrollPos = $find("myGrid")._elements.vScrBar.scrollTop

You will always get accurate vertical scroll position.

Infragistics WebSplitter: Set SplitterBar’s CSS class in clinet-side JavaScript

$
0
0

Hello there. Haven’t written in a while, been busy participating in Stack Overflow community, but this little bit I found interesting.

Infragistics has a cool versatile Web Splitter control in their ASP.NET suite, but recently I encountered a shortcoming – there’s no way to set a CSS class for splitter bar on client-side via JavaScript. On server-side you can do something like

xMySplitter.SplitterBar.CssClass = "hiddenElement";

On client-side – you can get the CSS class via

var sCss = $find('xMySplitter').get_splitterBarCss()

but there’s no counterpart set_splitterBarCss() method.

Digging a little deeper I found that on client-side WebSplitter object has _elements collection which consists of top-level DOM elements that constitue WebSplitter control. In particular _elements.d0 corresponds to splitter bar. Knowing this – the rest is easy. The code below attaches add_splitterBarCss method to WebSplitter object:

var oMySplitter = $find('xMySplitter');

oMySplitter.add_splitterBarCss = function(i_sCss) {
   Sys.UI.DomElement.addCssClass(this._elements.d0, i_sCss)
}

Using Microsoft Ajax Library’s (which is already part of the page anyway) Sys.UI.DomElement.addCssClass method we apply CSS class to relevant element.

We can even add a removal function that would remove unneeded CSS class:

oMySplitter.remove_splitterBarCss = function (i_sCss) {
   Sys.UI.DomElement.removeCssClass(this._elements.d0, i_sCss)
}

The advantage of the above functions – if multiple other classes are applied to the splitter bar (infragistics themes, etc.), the add_splitterBarCss/remove_splitterBarCss functions will not touch them and only affect class passed as function parameter. Examples of usage:

oMySplitter.add_splitterBarCss('hiddenElement');
oMySplitter.remove_splitterBarCss('FullColorSplitter');

How to receive Stack Overflow notifications on your phone and smartwatch

$
0
0

If this then that

As you may have gathered I am a frequent participant of Stack Overflow Q&A board for coders. On that site everytime somebody responds to your question or comments – a notification is displayed in the status bar. Ditto when your reputation points change.

I became curious whether I could receive these modifications on my phone. Stack Exchange released their own application on Google Play store that does send push notifications when a reply is received, but no notifications on reputation changes. Also it’s still a little rough around the edges and besides I realized I didn’t want a full blown Stack Overflow application (when I do use SO for questions/answers I prefer the full site on my laptop). There should be another way.

There is – it’s called IFTTT or “if this then that”. Basically this service allows you to perform an action based on a trigger (e.g. IF I post and Instagram picture THEN re-post it to twitter). One of the triggers is “read RSS feed and perform action if there’re new items” – I could use that since Stack Overflow provides RSS feeds both for user replies and reputation changes.

Now for action – you can chose, for example email (If my reputation changes then send an email) but I went a step further. I purchased a little, but very useful push-notification app called Pushover that can receive messages from various sources (including IFTTT) and display them as notifications on your device. So now, every time I can receive direct push notifications about my SO status.

If you plan to use IFTTT/Pushover combination you can create your own IFTTT “recipe” from scratch or you can reuse ones I created (just adjust the RSS feed to point to your Stack Overflow user ID):

SO IFTTT update on PebblePushover application has one really nice bonus – native notifications to Pebble Smartwatch, no separate notification application needed.

This is very convenient, especially if you don’t have immediate access to your phone – just a brief glance at your wrist tells you what is going on.

Seeing the notification you can deem the importance and choose whether to ignore it for now, or drop whatever it is you were doing, fire up your dev laptop and give the other fella hell provide polite and responsible reply.

Display “Lose It!” data on Pebble watchface

$
0
0

Original Lose It!Lose It! on Pebble

Lose It! is an excellent service that helps people lose weight by monitoring calories intake. It integrates with variety of devices so I was curious if I can display my user data on Pebble smartwatch (to make sure I can have another piece of cake or not).

Unfortunately LoseIt doesn’t have a public API. There had to be another way.

Enter screen scraping. When you login into LoseIt, homepage show all the information (total calories allowance, calories consumed, calories burned etc.) We can harvest this information and pass along. To simplify this I am using TamperMonkey for Chrome browser which allows you to run custom scripts against any webpages. It does require a browser with the page open constantly running, which is not a problem if you have a machine running 24/7. But all in all – this is just a proof of concept.

So here the idea:

  1. Harvest data from LoseIt homepage with TamperMonkey
  2. Send harvested data to Pushover.Net notification service
  3. Pushover will generate notification to their Android app
  4. Pushover for Android will act as trigger for Tasker
  5. Tasker will use Canvas for Pebble as an action to generate Canvas layers
  6. Canvas will display received information on Pebble watch

Yeah it looks like this approach but it’s fun to build the chain and it works.

Here’s a complete TamperMonkey script to get the data and post it to PushOver:

// ==UserScript==
// @name       LoseIt data scrap
// @namespace  http://codecorner.galanter.net/
// @version    0.1
// @description  Scraps data from LoseIt page
// @match      http://www.loseit.com/
// @require http://ajax.googleapis.com/ajax/libs/jquery/1.10.1/jquery.min.js
// @copyright  2014, Yuriy Galanter
// ==/UserScript==

setTimeout(function() {
    
    var $aTotal = $('.GN30PYJCMVB');
    var $aDetails = $('.GN30PYJCDNB');
    
    if (localStorage['remain'] != $aTotal[4].innerText) {
        
        localStorage['remain'] = $aTotal[4].innerText;

        var sMessage = 'Budget: ' + $aTotal[0].innerText + '^';
    	sMessage += $aDetails[0].innerText + '^';
    	sMessage += $aDetails[1].innerText + '^';
    	sMessage += $aDetails[2].innerText + '^';
    	sMessage += $aDetails[3].innerText + '^';
        sMessage += $aDetails[4].innerText + '^';
    	sMessage += (parseInt($aTotal[4].innerText) >= 0? 
                      'Under: ' : 'Over: ') + $aTotal[4].innerText;
    
		$.post("https://api.pushover.net/1/messages.json",
    			{
      				token: '[your PushoverApplication token]',
      				user: '[your PushOver user token',
     				message: sMessage,
      				title: 'LoseIt',
     				priority: -2
                }, function() {
                    location.reload();
                }
    	)
    } else {
     	location.reload();   
    }    
 
}, 900000)

As you can see script matches only http://www.loseit.com/ site (you have to be already logged in) and using jQuery class selector retrieves DOM elements holding total amounts (Budget, remaining calories etc.) and details (calories eaten at breakfast, lunch, dinner etc.). The script checks whether newly retrieved value of remained calories changed comparing to a saved one and if it doesn’t – simply reloads the page to retrieve fresh values.

If the amount changed – the script then constructs out of selected elements a “^” separated string message for future parsing. After that the script sends the constructed message to Pushover. Note that you have to have a user account there and you have to register your application there to get a token. Note also that message is sent with “priority: -2″ – this will not generate an notification alert on your device, but it will still act as a Tasker trigger. After message is posted – page is reloaded to retrieve fresh values. Entire script is wrapped into `setTimeout` function to run every 15 minutes.

Web side is done. Now on your android device start Tasker and select Pushover plugin as trigger for profile, in its configuration tell it to match title “LoseIt”. Connect it to a task that first split %pushovermessage variable by ^ splitter. After that add 7 Canvas tasks that map respective split variables to Tasker entries:

  • %pushovermessage1 – LoseIt Budget
  • %pushovermessage2 – LoseIt Breakfast
  • %pushovermessage3 – LoseIt Lunch
  • %pushovermessage4 – LoseIt Dinner
  • %pushovermessage5 – LoseIt Snack
  • %pushovermessage6 – LoseIt Exercise
  • %pushovermessage7 – LoseIt Remained

Tasker part is done. Now open Canvas for Pebble to build watcface to your liking and fill it with dynamic layers of Content:Tasker and tasker items described above.

See, wasn’t that easy?

Flipping pebbles

$
0
0

Big Flip Clock

As far as smartwatches go – Pebble is a lot of fun. But after playing around with Watchface Generator, Canvas for Pebble and numerous other apps I wanted something more, something that only Pebble SDK could provide. A coder in me wanted to code.

Enter CloudPebble – an amazing online development environment that runs in your browser, has a full-blown C compiler and connects to your watch to run/debug compiled apps. Plus your projects are stored on the cloud and available anywhere you can get online.

Yes you program Pebble in classic C – and it’s a lot of fun. And my first real attempt at custom watchface (pictured above) is old-style flip clock, you can get it here. It is based on amazing pebble bitmap library by Gregoire Sage

Infragistics WebDataGrid stalls on paging large datasets

$
0
0

A common scenario while using Infragistics WebDataGrid is to have an unbound column, whose cell’s value is determined at runtime in InitializeRow event, something like

Private Sub xmyGrid_InitializeRow(ByVal sender As Object, ByVal e As GridControls.RowEventArgs) Handles xmyGrid.InitializeRow
   '... some code
   e.Row.Items(0).Value = SomeCalculatedData
   '... some more code
End Sub

This works fine if you bind the grid to a small data set (and you should!) But if, due to circumstances out of your control, you bind it to a dataset with tens of thousand of records you might be screwed. Even if you enable paging (and you most definitely should!) you may find yourself living in a shotgun shack in a situation that changing page takes forever and eventually crashes. If you do – change the above line to

e.Row.Items(0).Text = SomeCalculatedData

note using of .Text property, which is String, instead of .Value which is Object. Since you’re assigning the calculated data for presentation only – no need to change underlying value – and this makes all the difference.

Infragistics WebDataMenu flashes unexpected color on hover

$
0
0

WebDataMenu
Infragistics WebDataMenu ASP.NET control comes both with predefined stylesets and allows you granularly overwrite any of the styles. For example definition like this

<ig:WebDataMenu ID="xmyMenu" runat="server" StyleSetName="Office2007Blue"
                 CssClass ="topMenuStyle" >
   <GroupSettings Orientation="Horizontal" />
   <ItemSettings CssClass="itemCssStyle" 
                 HoverCssClass="hoverCssStyle" 
                 SelectedCssClass="selectedCssStyle" />  
</ig:WebDataMenu>

will create a horizontal dropdown menu in default “Office 2007 Blue” styleset but allows you to overwrite individual styles via exposed CSS properties.

Let’s take a look at hover style. After somewhat painful research I found that in order for it to work correctly for both root and submenu levels – you have to apply it to specific DOM elements rendered by menu control:

div.topMenuStyle > div > ul > li.hoverCssStyle {
  /* this hover style will apply to top level menu */
}

div.topMenuStyle > div > div > div ul > li.hoverCssStyle {
  /* this hover style will apply to submenus */
}

This works fine, but I noticed one major annoyance: when I hover over menu item – it briefly flashes orange background before switching to correct color defined by “hoverCssStyle” class. After doing some digging I realized that in addition to styles for “item”, “hover” and “selected” – grid also uses “active” style – this is what caused brief display of unexpected color or, more precisely in horizontal menu that uses “Office2007Blue” it’s:

  • .igdm_Office2007BlueMenuItemHorizontalRootActive – “active” style for top level menu
  • .igdm_Office2007BlueMenuItemVerticalActive – “active” style for dropdown items.

Your mileage may vary (you may have a vertical menu or use different styleset), but that’s the gist of it – there’re “active” classes that affect grid hover appearance. Unfortunately grid doesn’t expose these as property of the grid to allow you to overwrite them, like it does with “hover” and “selected” styles. Fortunately there’s an easy workaround – all you have to do is redefine these classes in your own stylesheet. In my case I wanted them to be exactly like hover ones, so I simple added them to the original CSS definitions:

div.topMenuStyle > div > ul > li.hoverCssStyle,
.igdm_Office2007BlueMenuItemHorizontalRootActive {
  /* this hover style will apply to top level menu */
}

div.topMenuStyle > div > div > div ul > li.hoverCssStyle,
.igdm_Office2007BlueMenuItemVerticalActive {
  /* this hover style will apply to submenus */
}

Bingo. No more orange flashes, just nice and stylish hover effect.

Viewing all 79 articles
Browse latest View live